Stop Disappointing Everyone: Optimize Your Batch Size
I'm going to use the terms job size and batch size interchangeably in the article below. I apologize for any confusion this might bring on.
Intro
The business need was identified and you really did do your research before pitching a new piece of kit to the executives. Not wanting to get burned again, you ignored what the vendor's sales team pitched the throughput as and tested it with your own materials. It was in the specification and validated at the factory and site acceptance tests. You even convinced your VP to spend some extra to get the big-boy model that whipped units out at speeds that would blow the standard you provided to Estimating away...
Despite all that, you're spending an absurd amount of time tracking downtime events and trends, following up with the vendor, and generally diffusing responsibility for the equipment/vendor choice over the entire Value Stream team.
What's gone wrong? Why is the equipment producing below estimate? Could be a lot of things, and I really hope for your sake that you figure it out relatively quickly.
From experience, I would suggest looking past the unusually high downtime for a moment. While it does tend to grab attention in shift notes, that's probably just the bathtub curve in action. I can suggest another path which might increase your efficiency more than any amount of reliability reporting and module redesigns might.
Increase your job size. Or maybe, increase your batch size.
That's it, that's the advice. Minimize non-value added time while maximizing the value added stuff. Nothing ground breaking at face value. What isn't immediately intuitive is how the relationship between job size and throughput manifests.
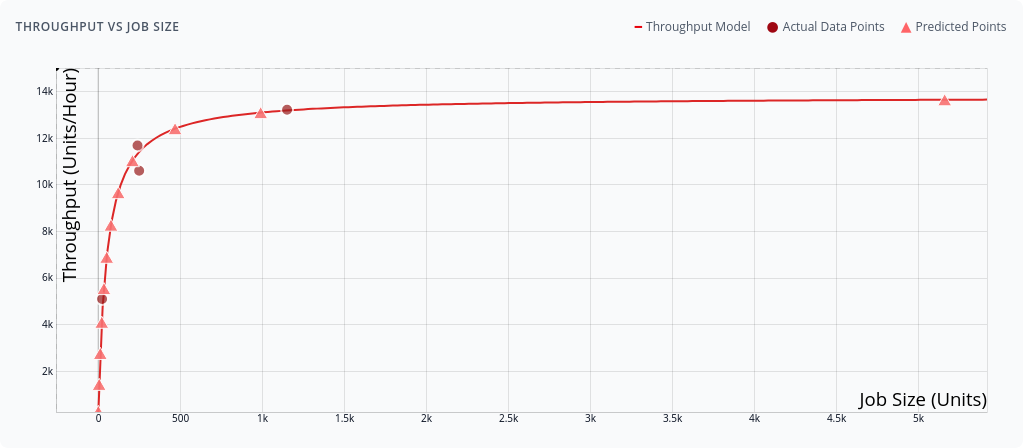
Did you know it looks like this?
Increasing job size doesn't always apply or solve all your issues, but it usually does a fair bit of work. More often than not, the batch size your team is processing was set back in the day, and you have entire systems built around that specific number of widgets moving from one work center to the next. Since originally settling into your batch size, maybe you've gained more clients and are running tight on capacity. Maybe the margins that once existed at that batch size aren't available anymore. Times have changed, overhead has raised, and the clients have been convincing your sales team for decades to give them more for less. Regardless of what's causing the heat, that original batch size could be leaving capacity and savings on the table that you could tap into.
If you bring this advice blindly back to your team, not much will change. There will be individuals in your org who will wave their arms and say it's too big an ask and that you need to get back to focusing on downtime. I've made a simple tool which you can use to demonstrate how increasing your job size would affect your production and I'm going to walk you through how it works so you can make your own custom implementation in Excel or whatever language you prefer.
Batch Size Optimizer
The tool is free to use. It executes fully in your browser and contains no server side logic. You can even save the page from your browser and run it locally offline. You'll still need an internet connection to get the function-plot library used for displaying the graphs, if you feel you need them.
How to Use the Tool
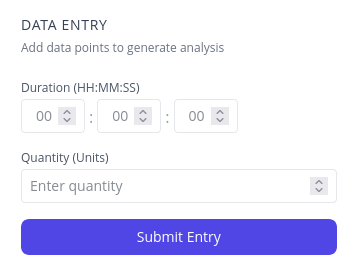
Start by timing a few production runs at different batch sizes. Don't go crazy here. You need 2 data points minimum, but 4-6 will give you a solid model. Mix it up with your batch sizes: run some small ones, some at your current standard, and push a couple larger ones through. Record the total time from start to finish and the quantity processed.
Keep in mind that "start to finish" is subjective to what you're trying to measure here.
- When the first unit is pulled in to when the last unit hits the output? Maybe add your average downtime between jobs to each entry to better reflect the workcenter.
- From the end of the last job to the end of this job?
- Including material staging and quality inspection time at both ends?
- Door-to-door time including all the paperwork, tool changes, and first article inspections?
- Just the value-added machine time, excluding operator breaks and shift changes?
- Full cycle including warmup, production, cooldown, and cleaning?
- From work order release to pallet wrap at shipping?
- Clock starts when material hits the floor until product leaves the building?
Regardless, when you enter these data points, the tool fits a linear regression to your time vs quantity data, then derives a throughput model that shows you exactly how your efficiency changes with batch size. You'll see two key graphs:
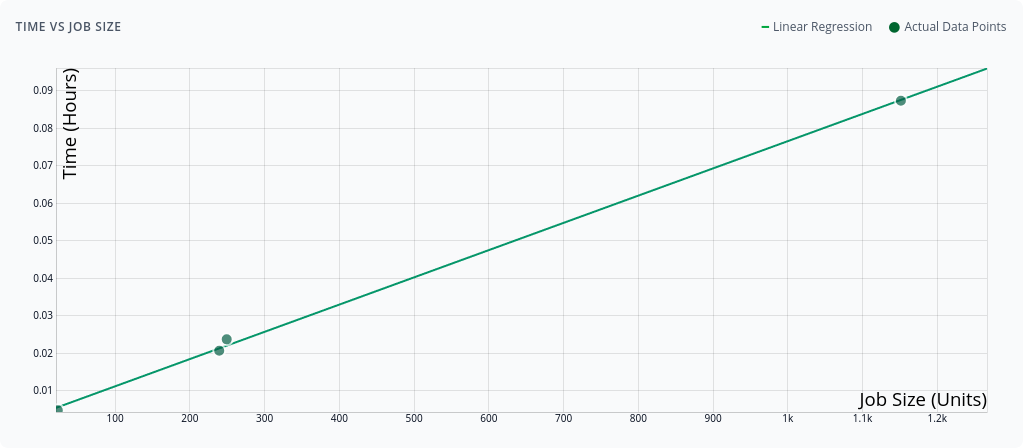
- Time vs Job Size - This should be relatively linear, showing your fixed setup time (the y-intercept) and your per-unit processing time (the slope)
- Throughput vs Job Size - This is where the money is. You'll see a hyperbolic curve that starts low and climbs toward a theoretical maximum
Understanding the Results
The throughput curve tells the real story. At small batch sizes, you're getting killed by setup time. That curve climbing steeply? That's your opportunity. The flattening at the top? That's where you're approaching the machine's theoretical maximum, or the throughput you'd get if you could run forever without stopping.
Look for the "sweet spot". Typically around 80-95% of theoretical maximum. Going beyond this means massive batch sizes for marginal gains.
The predictions table breaks it down further, showing efficiency percentages for different batch sizes. Pay attention to these efficiency levels:
- Below 50%: You're leaving serious money on the table
- 50-75%: Room for improvement
- 75-90%: The sweet spot for most operations
- Above 90%: Diminishing returns territory
What the Numbers Actually Mean
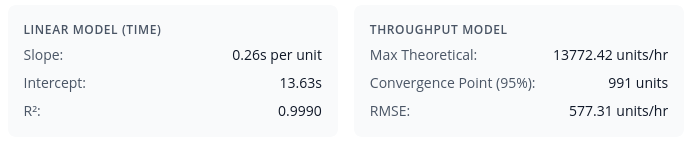
Let's talk about what you're seeing in real terms. That "slope" value in the linear model? That's your actual processing time per unit. The "intercept"? That's your fixed overhead. Setup, machine filling, teardown, paperwork, all the non-value-added stuff that happens regardless of batch size.
When the tool shows a "Convergence Point" at, say, 500 units, it's telling you that's where you'll hit 95% of your theoretical maximum throughput. Running 1000 units instead of 500 might only bump you from 95% to 97% efficiency. Probably not worth doubling your batch size for a 2% gain.
Common Pitfalls and Reality Checks
If you're getting negative slopes or intercepts, something's wrong with your data. Either your measurements are off, or you've got some weird dynamics at play (like faster processing at higher volumes due to parallelization). The tool will warn you about this.
Don't ignore practical constraints. Sure, the model might say your optimal batch is 10,000 units, but if your biggest order is 2,000 units, you've got a problem. Consider:
- Storage capacity at both ends of the process
- Cash flow implications of larger WIP
- Quality risks with longer production runs
- Customer order patterns and lead time expectations
Making the Business Case
Armed with this data, you can make a compelling case for batch size changes. Calculate the capacity gain: if moving from 100-unit to 250-unit batches takes you from 60% to 85% efficiency, that's a 42% capacity increase without buying new equipment.
Translate this to dollars. If your work center runs 2000 hours annually at $200/hour fully loaded, that efficiency gain is worth $100,000 per year in labor. Not bad for just changing your target job size.
Share Your Analysis
The tool generates shareable links at the bottom of the Data Entry section that preserve your data points and analysis. Use these to collaborate with your team or save different scenarios. No login required, no data stored on servers, just compressed parameters in the URL.
The Math Behind It (For the Curious)
The tool uses a simple approach:
- Linear regression on time vs quantity gives us:
Time = (slope × quantity) + intercept - Throughput is just the inverse:
Throughput = quantity / Time - Substituting:
Throughput = quantity / ((slope × quantity) + intercept)
This creates a hyperbolic curve that approaches 1/slope as quantity approaches infinity, your theoretical maximum throughput if setup time was zero.
DIY in Excel
Want to build this yourself? Here's how to set it up in Excel:
Step 1: Set up your data
Create columns for your measurements:
- Column A: "Quantity" (your batch sizes)
- Column B: "Time (hours)" (total time for each batch)
- Column C: "Throughput" with formula:
=A2/B2
Step 2: Calculate the linear regression parameters
Assuming your data is in rows 2-7:
Slope (time per unit):
=SLOPE(B2:B7, A2:A7)
Intercept (fixed setup time):
=INTERCEPT(B2:B7, A2:A7)
R-squared (fit quality):
=RSQ(B2:B7, A2:A7)
Step 3: Create predictions table
Set up a new table with quantities you want to evaluate:
- Column E: Quantity values (1, 10, 50, 100, 250, 500, 1000, etc.)
- Column F: Predicted Time
- Column G: Predicted Throughput
- Column H: Efficiency %
Column F: Predicted Time (assuming slope in D10, intercept in D11):
=E2*$D$10+$D$11
Column G: Predicted Throughput:
=E2/F2
Theoretical Max Throughput (in a separate cell, say D12):
=1/D10
Column H: Efficiency Percentage:
=G2/$D$12*100
Step 4: Find the sweet spot
To find where you hit 95% efficiency:
=(0.95*D11)/(D10*(1-0.95))
This gives you the quantity where you'll achieve 95% of theoretical maximum throughput.
Step 5: Create the charts
- Time vs Quantity: Scatter plot of columns A and B, add trendline with equation displayed
- Throughput vs Quantity:
- Plot actual data (columns A and C) as scatter points
- Plot predictions (columns E and G) as a smooth line
- Add a horizontal line at theoretical max (1/slope) to show the asymptote
Final Thoughts
Batch size optimization isn't sexy, but it will net you wins on those occasions you just need some wind at your back. Before you spend big money on new equipment or beat up your maintenance team about every downtime event, spend an afternoon collecting data and running this analysis.
The biggest wins often come from the simplest changes. Sometimes that multi-million dollar capacity expansion can be replaced by changing "100" to "250" in your production planning system. Your CFO will love you, your operators will have fewer setups to deal with, and you'll look like a genius for finding capacity that was there all along.
Just remember to actually implement the changes. I've seen too many great analyses die in PowerPoint purgatory while the shop floor keeps running the same batch sizes they've used since Bush junior was president.
Remember Bush? Man, we thought we had it rough then. Sweet summer children. :)